Staff R T1, Murray A D2, Ahearn T S1, Counsell C E3, Taylor K3, Wilson K4, Gemmell H G1. University of Aberdeen and Aberdeen Royal Infirmary; 1Department of Bio-Medical Physics and Bio-Engineering, 2Department of Radiology, 3Department of Medicine and Therapeutics. 4Pukka-J Limited.
The traditional media of information dissemination used by radiopharmaceutical companies and the nuclear medicine community limits the support given to users of fpcit. The distribution of glossy sales brochures and academic publications, although useful, cannot raise competence to the level that only comes with viewing large numbers of images.
We have designed and built a web-based archive that enables users to view a large cross-section of images from a range of sources. Images and clinical data are contained in the site along with interpretations of the data from experienced users. The site contains mining tools that enable users to interrogate the archive. For example, ‘Show me images of those subjects in the archive that have a specific clinical presentation’. Alternatively the site allows users, through software bound into the site, to search for images with specific characteristics, for example uptake, shape and size.
Data mining
Presentation mining
I have a patient with a particular set of presentation characteristics. Show me images of a patient in the database with a similar set of characteristics.
The site has a series of windows that allow users to look at images with a specific presentation characteristic. One of these windows is shown in Figure 1.
 Figure 1:
A window from the presentation mining section of fpcit.net.
Image mining
I have a set of patient images with a particular appearance. Show me images of patients in the database that look like this.
The site allows users to interrogate the imaging archive base on a number of imaging characteristics. For example show me images that have a caudate to background ratio of X calculated using a particular software approach. Figure 2 shows a particular software approach which comes as part of the Quantispect software and measures the ratio of the striatum to the occipital cortex.

Figure 2: The regions of interest used to quantify the striatum to background ratio.
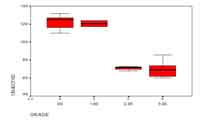
Semi quantitative techniques such as this do not produce ideal discrimination between Parkinsonian and non Parkinsonian patients. There is also some discrepancy between the visual interpretation and the semi-quantified value. Figure 3 shows a box plot of the visual interpretation and the quantified value.
Figure 3: Plot of semi quantified uptake and visual classification
The site also uses a pattern recognition technique to identify similar images. Image data can be uploaded to the site, processed on-line, and compared to the database. Figure 4 shows how the size and shape are extracted.
 Figure 4: Extracting the size and shape from each striatum
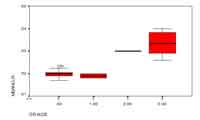
NS/EW RATIO
 Figure 5: Plot of shape measure and visual classification. The NS/EW ratio is the ratio if the length of the longest to the shortest axis.
SIZE AREA
The relationship between each shape measure and the visual classification is shown in Figure 5. Using a combination of shape and size and a nearest neighbor technique for classification the software had a kappa statistic of 0.91 when compared to an experienced observer.
Although this site is based around fpcit its structures and concept are generic for new imaging radiopharmaceutical techniques. fpcit.net provides a data archive and image processing tools that can aid any new users to ascend the learning curve. It is free, and has a powerful connectivity tools which enables it to be used with data acquired from any system.

